library(ggplot2)

N_size<-seq(40,100,10)
n_size<-Final_Result_No_Repetition<-Final_Result_Repetition<-list()

for (i in 1:length(N_size))
{
  Temp_n_values<-as.matrix(seq((N_size[1]/2),(N_size[i]-1),5))
  n_size<-apply(Temp_n_values,1,function(Temp_n_values){
    factorial(N_size[i])/(factorial(Temp_n_values)*factorial(N_size[i]-Temp_n_values)) })

  Final_Result_No_Repetition[[i]]<-data.frame("Big_data_size"=paste0("N = ",N_size[i]),
                                              "Subsample_size"=Temp_n_values,
                                              "No_of_Subsamples"=n_size)

  n_size<-apply(Temp_n_values,1,function(Temp_n_values){
    factorial(N_size[i]+Temp_n_values -1)/(factorial(Temp_n_values)*factorial(N_size[i]-1)) })

  Final_Result_Repetition[[i]]<-data.frame("Big_data_size"=factor(paste0("N = ",N_size[i])),
                                           "Subsample_size"=Temp_n_values,
                                           "No_of_Subsamples"=n_size)
}

Final_Result_No_Repetition<-do.call(rbind.data.frame,Final_Result_No_Repetition)
Final_Result_Repetition<-do.call(rbind.data.frame,Final_Result_Repetition)

Final_Result_Repetition$Big_data_size<-factor(Final_Result_Repetition$Big_data_size,
                                              levels = paste0("N = ",N_size),
                                              labels = paste0("N = ",N_size))

Final_Result_No_Repetition$Big_data_size<-factor(Final_Result_No_Repetition$Big_data_size,
                                                 levels = paste0("N = ",N_size),
labels = paste0("N = ",N_size))Number of subsamples, that is sampling
Blog
Subsampling
Big data
Analysing big data is computationally intensive and to resolve this scalable methods are developed, for example subsampling. Obtaining a subset of the big data based on a research aim and analysing this subset is called subsampling. Obviously it is not possible to identify the most optimal or informative subsample, however there are methods that can provide sub-optimal subsamples. A common technique is identifying a distribution for the subsampling probabilities that assigned to each observation of the big data and obtain a subsample based on these probabilities.
In this blog post I explore the relationship between number of subsamples with the big data and subsample size. I consider two possible scenarios, 1) subsample without repetition and 2) subsample with repetition. The number of subsamples for the first scenario can be obtained by \(P(N,n)=\frac{N!}{(N-n)!}\) and for the latter through \(P_{Rep}(N,n)=\frac{(N+n-1)!}{n!(N-1)!}\), where \(N\) is the big data size and \(n\) is the subsample size. Using subsampling probabilities is similar to with repetition.
Comparing \(N,n\) with \(P(N,n)\) and \(P_{Rep}(N,n)\) under big data is computationally impossible. Amid this to complete the comparison the following small values \(N=40,50,\ldots,100\) and \(n_i=N_i/2,N_i/2+5,N_i/2+10,\ldots,N_i-1\) are used. Here \(n_i\) represents the \(i\)-th element of the sequence, starting from \(N_i/2\) and increasing by \(5\) each step until reaching or surpassing \(N_i−1\). Note that the sequence ends before \(N_i\), as it is specified to go up to \(N_i−1\).
Based on the setup the number of subsamples were calculated and are plotted below.
Based on subsampling without replacement it seems that the number of samples increase until the \(n=N/2\), and after this the number of samples descreases. This highest no of subsamples is still large even if \(N\) and \(n\) small values, for actual big data this value might not be calculable.
ggplot(Final_Result_No_Repetition,
       aes(x=factor(Subsample_size),y=log10(No_of_Subsamples),group=Big_data_size,color=Big_data_size))+
  geom_point()+geom_line()+
  xlab("n (Subsample size)")+ylab("log10(No of subsamples)")+
  ggtitle("Changes in number of subsamples for different big data and subsample sizes",
          subtitle = "Subsamples without replacement")+
  scale_color_viridis_d()+labs(color="Big data size")+
  theme_bw()+theme(legend.position = "bottom")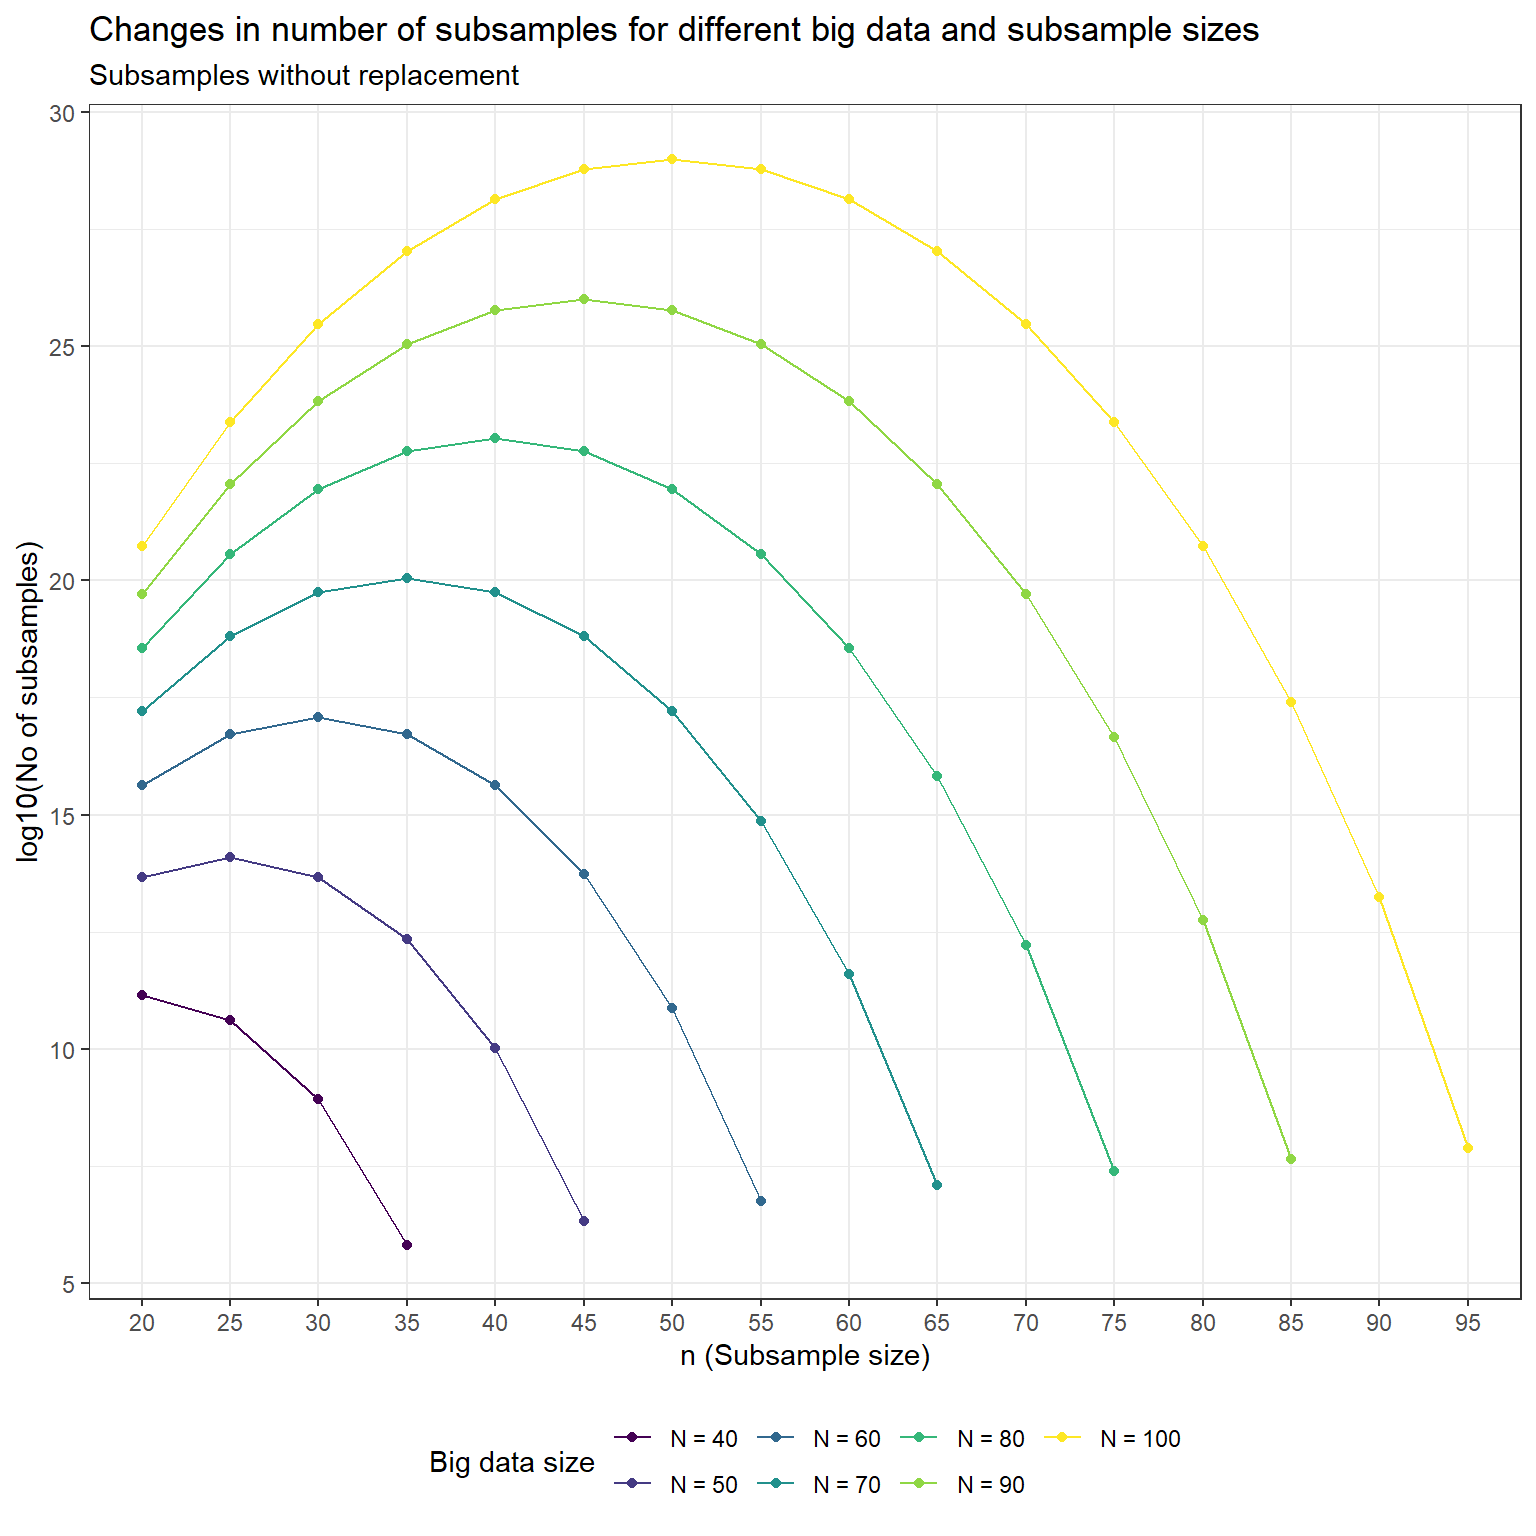
For subsapling with replacement the number of subsamples increase gradually with the subsequent subsample sizes. Compared to subsampling without replacement with replacement has higher number of subsamples under the same set of big data and subsample sizes.
ggplot(Final_Result_Repetition,
       aes(x=factor(Subsample_size),y=log10(No_of_Subsamples),group=Big_data_size,color=Big_data_size))+
  geom_point()+geom_line()+
  xlab("n (Subsample size)")+ylab("log10(No of Subsamples)")+
  ggtitle("Changes in number of subsamples for different big data and subsample sizes",
          subtitle = "Subsamples with replacement")+
  scale_color_viridis_d()+labs(color="Big data size")+
  theme_bw()+theme(legend.position = "bottom")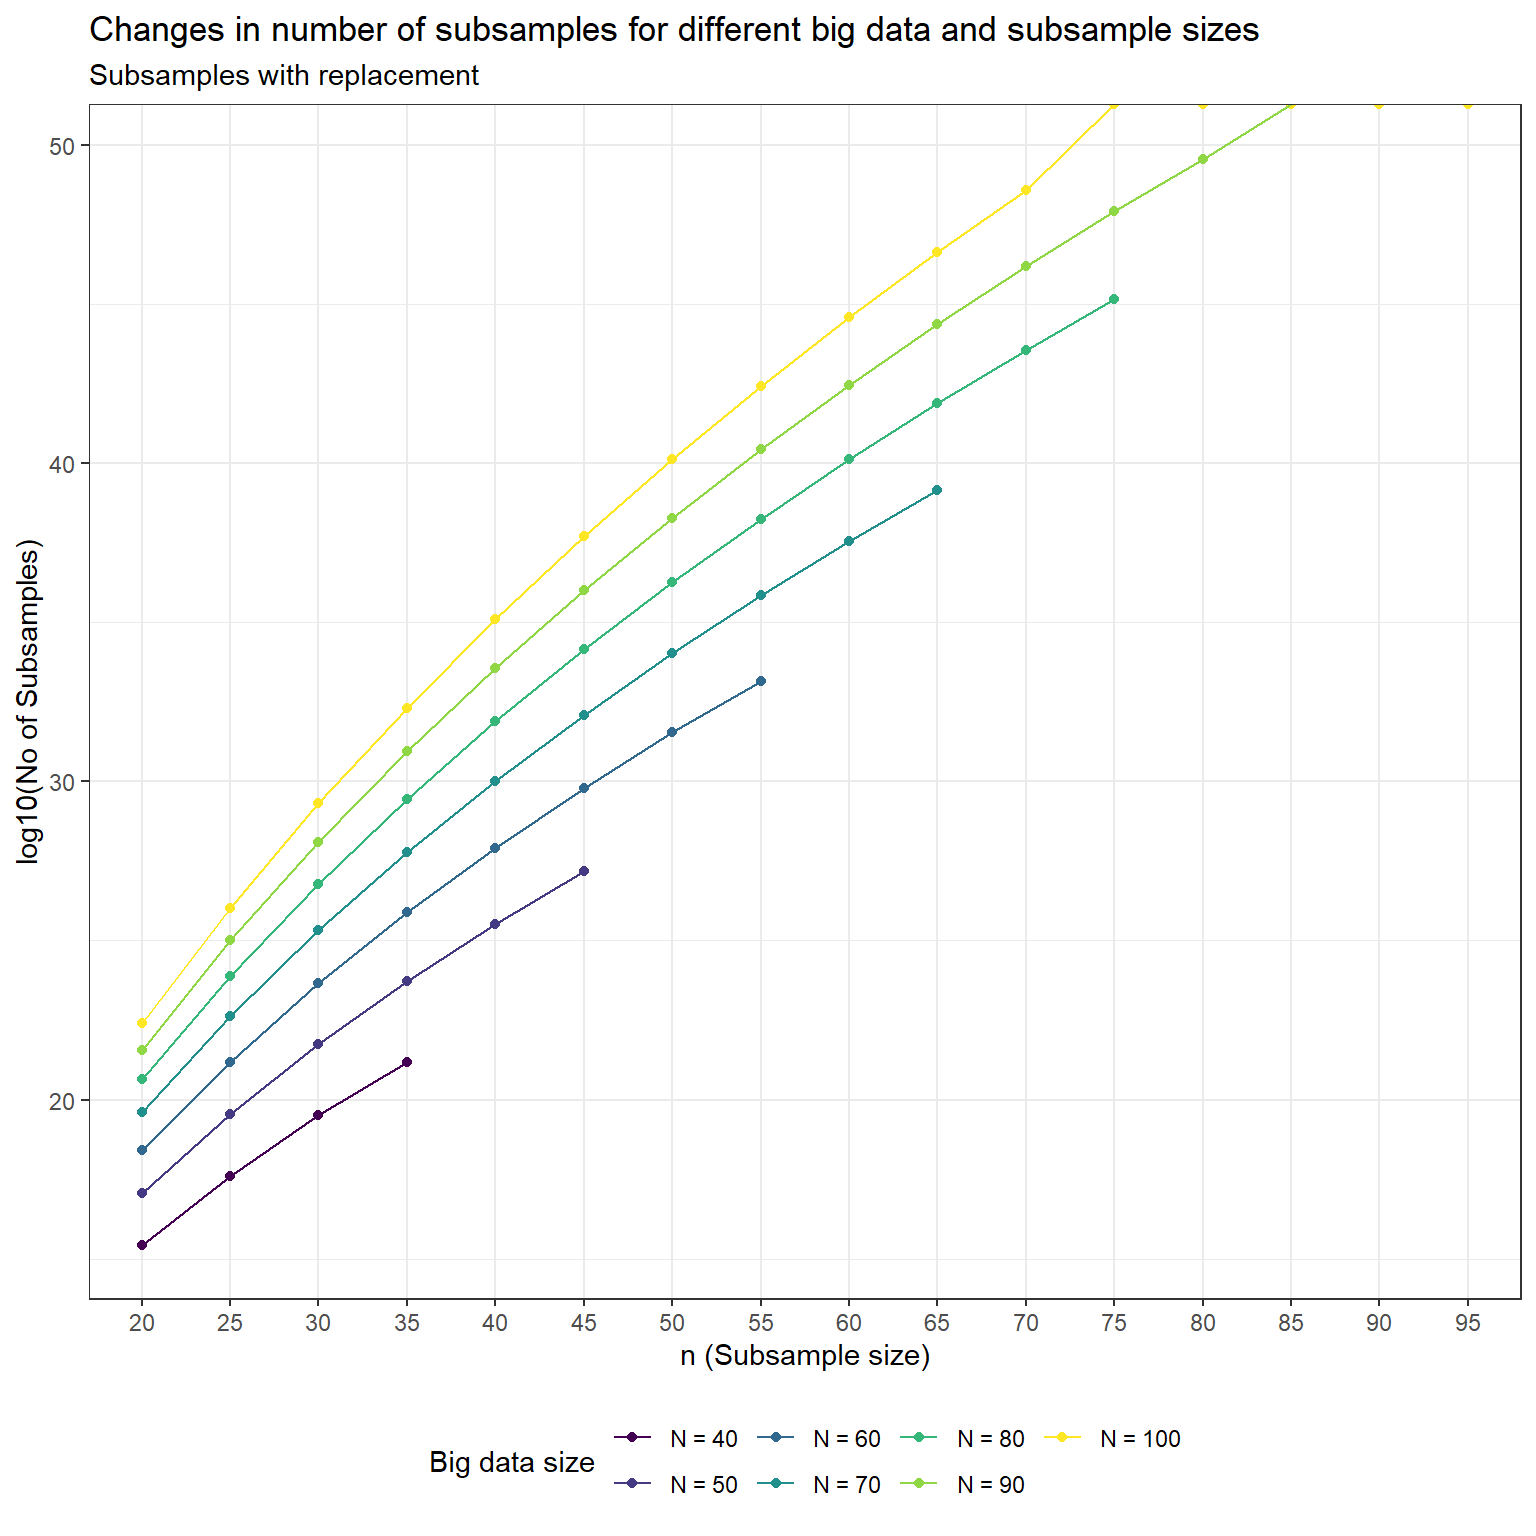
So in conclusion it is difficult to find an informative subsample as the number of subsamples increase exponentially. This leads to the necessity of subsampling methods that efficiently identify subsamples.
Further we explore the the number of subsamples under a reasonable big data and different subsample sizes with the help of the R package RcppAlgos. Here rather than focusing on the number of subsamples we look at the number of digits in the possible number of subsamples. For this we set \(N=10000,20000,\ldots,50000\) and \(n=200,300,\ldots,1500\), which are common values throughout articles related to subsampling for big data.
library(RcppAlgos)

N_size<-c(1:5)*10000
n_size<-c(2:15)*100
Final_Result_No_Repetition<-Final_Result_Repetition<-NULL
Final_Results<-list()

for (i in 1:length(N_size))
{
  for (j in 1:length(n_size))
  {
  Final_Result_No_Repetition[j]<-gmp::log10.bigz(comboCount(v=N_size[i],m=n_size[j],repetition=FALSE))
  Final_Result_Repetition[j]<-gmp::log10.bigz(comboCount(v=N_size[i],m=n_size[j],repetition=TRUE))
  }

  data.frame("Big_data_size"=factor(N_size[i]),"Subsample_size"=rep(n_size,2),
             "Type"=factor(rep(c("Without Repetition","With Repetition"),each=length(n_size))),
             "No_of_digits"=c(Final_Result_No_Repetition,Final_Result_Repetition))->Final_Results[[i]]
}

Final_Results<-do.call(rbind,Final_Results)

ggplot(Final_Results,aes(x=factor(Subsample_size),y=No_of_digits,color=Big_data_size,shape=Type,linetype=Type,
                         group=interaction(Big_data_size,Type)))+
  geom_point()+geom_line()+
  scale_shape_manual(values = c(8,16) )+scale_linetype_manual(values = c("dotted","dashed"))+
  xlab("n (Subsample size)")+ylab("log10(No of digits)")+
  ggtitle("Changes in number of subsamples for different big data and subsample sizes",
          subtitle = "Subsamples with and without replacement")+
  scale_color_viridis_d()+labs(color="With/without repetition")+
  theme_bw()+theme(legend.position = "bottom") +
  guides(color=guide_legend(nrow = 2))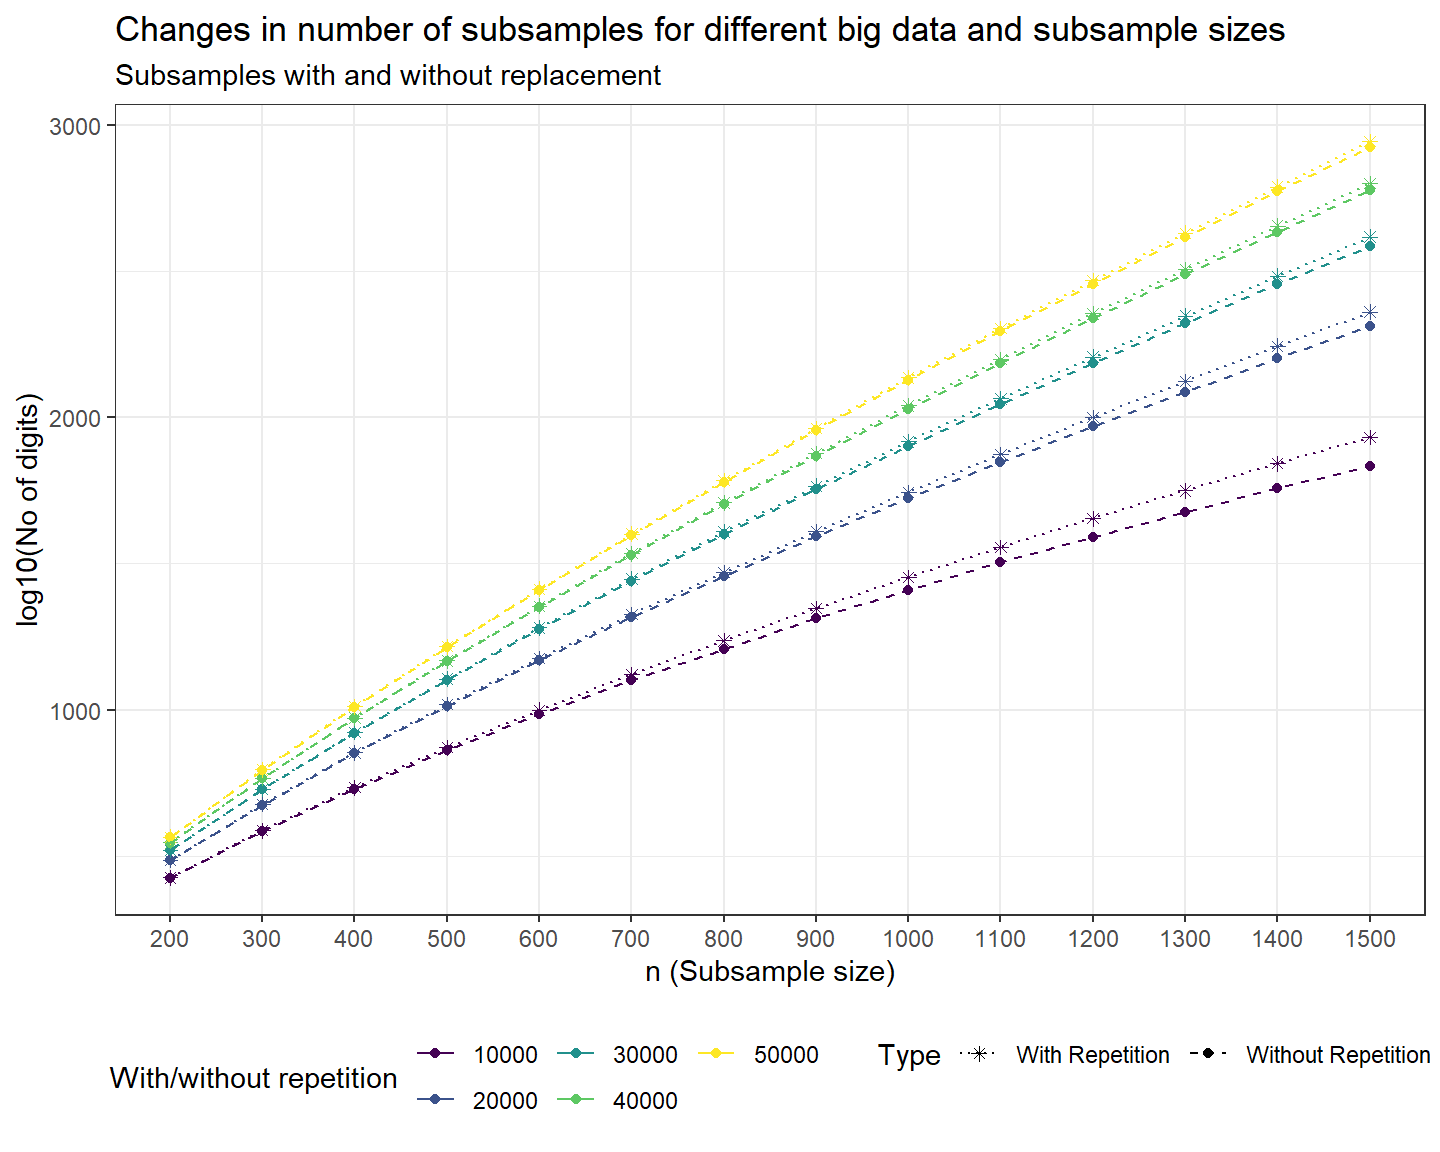
According to the above plot the number of subsamples by with repetition has more number of digits than without repetition. The number of digits increase when the subsample size increase and they further have higher values when the big data size is larger as well. For example, for \(N=50000\) and \(n=400\) the number of subsamples has close to 1000 digits under log scale of power 10, that is the number of subsamples is close to \(10^{1000}\). For clarity 1 trillion is \(10^{12}\), hence why we need subsampling methods as it is impossible to find the best subsample through going through all possible subsamples.
THANK YOU